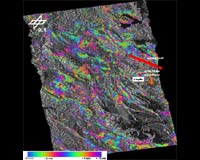
The image from the German TerraSAR-X radar satellite shows the area around the Italian town of L'Aquila after the magnitude 6.3 earthquake struck on 6 April 2009. Two images from the satellite were combined for the picture, taken before and after the earthquake, to create an interferogram.
The 'coloured rings' around L'Aquila stand out. These rings represent, in colour coding, the ground movement caused by the earthquake. One colour sequence represents a shift of about 1.6 centimetres; at the centre, there was a maximum subsidence of up to 20 centimetres.
The movement primarily occurred at the normal fault located northeast of L'Aquila, marked in red on the image. The topographical influence on the interferogram was removed using a digital elevation model in order to highlight the movement to a greater extent.
Region at risk of earthquakes
This interferogram represents a measurement of the effects of the quake; it does not predict possible future earthquakes. However, the information it provides supports the subsequent modelling of the geological processes and enables a detailed understanding of the causes.
The town of L'Aquila is situated in the Apennines, an approximately 1,500 kilometre-long mountain range which extends along the Italian peninsula. They are an alpidic (i.e. belonging to the Alps) fold and thrust belt, which began to arise about 50 million years ago.
The complex tectonic events in this region are determined by the collision of the Eurasian and African plates, the subduction (one plate moving under another) of the Adriatic microplate and the opening of the Tyrrhenian basin. The simultaneously occurring compression and expansion movements are the cause of the repeated earthquakes in this region.
For the analysis, two TerraSAR-X images, acquired in stripmap mode were used with a resolution of 1.7 x 3.4 metres. The first image was taken on 6 February 2009, the second on 13 April 2009.
Since the earthquake occurred during the time these two images were taken, this pair is very well suited for observing its effects. The two radar images were processed using the operational interferometric processing system 'PSI Genesis' developed by the German Aerospace Centre (DLR).
Share This Article With Planet Earth
